Do you want to switch the language?

Industrial Data Platform

Your central data platform
contact our experts nowcontact our experts now

The Industrial Data Platform (IDP) from CANCOM Austria is a central data platform designed to maximize efficiency and transparency in industrial production environments. It offers a comprehensive solution to the challenges associated with isolated data silos and a heterogeneous IT and OT landscape. By bundling all relevant data in a central system, the IDP enables seamless integration and analysis of information across different source systems and production components.

The IDP not only serves as a data hub, but also as a powerful interface for connecting various IT and OT systems. It helps companies to create customized reports quickly and efficiently and to automate the planning of production processes. It also promotes AI transformation by providing real-time information that enables proactive control and optimization of production processes.

With the Industrial Data Platform, companies can gain insights beyond their own value chain. It breaks down traditional silos and creates end-to-end transparency andtraceability, which are crucial for being able to react quickly to market requirements and continuously increase efficiency.

Bild (17)

Module-based industrial data platform for production-related data

IDP Moduluebersicht

The Data Hub of CANCOM Austria's Industrial Data Platform is the central nervous system that enables efficient data transmission and processing. As the heart of the platform, it acts as an interface to both operational technologies (OT) and information technologies (IT).

Operational technologies (OT): The Data Hub integrates a variety of protocols and standards such as OPC UA, S7, Modbus, M-Bus and LORAWAN. These enable direct communication with machines and systems. The connection to an MQTT broker also ensures efficient, event-driven data transmission.

Information technologies (IT): On the IT side, the data hub supports databases and cloud services such as MS SQL, PostgreSQL, Azure and AWS. This integration enables scalable data storage and analysis. Thanks to the connection to REST and HTTP, data can also be integrated and processed in web applications.

IDP Datahub

This central data hub is the starting point for optimizing productivity, transparency and energy costs.

Increase productivity:

The increase in productivity is supported by two modules. On the one hand, the OEE evaluation (Overall Equipment Effectiveness) enables effectiveness to be determined in real time. This key figure provides information on how efficiently and effectively machines and systems are actually being used.
Secondly, the IDP offers the possibility of precisely mapping production statuses, which leads to improved planning and control of production processes Planning and control of production processes processes.

Create transparency:

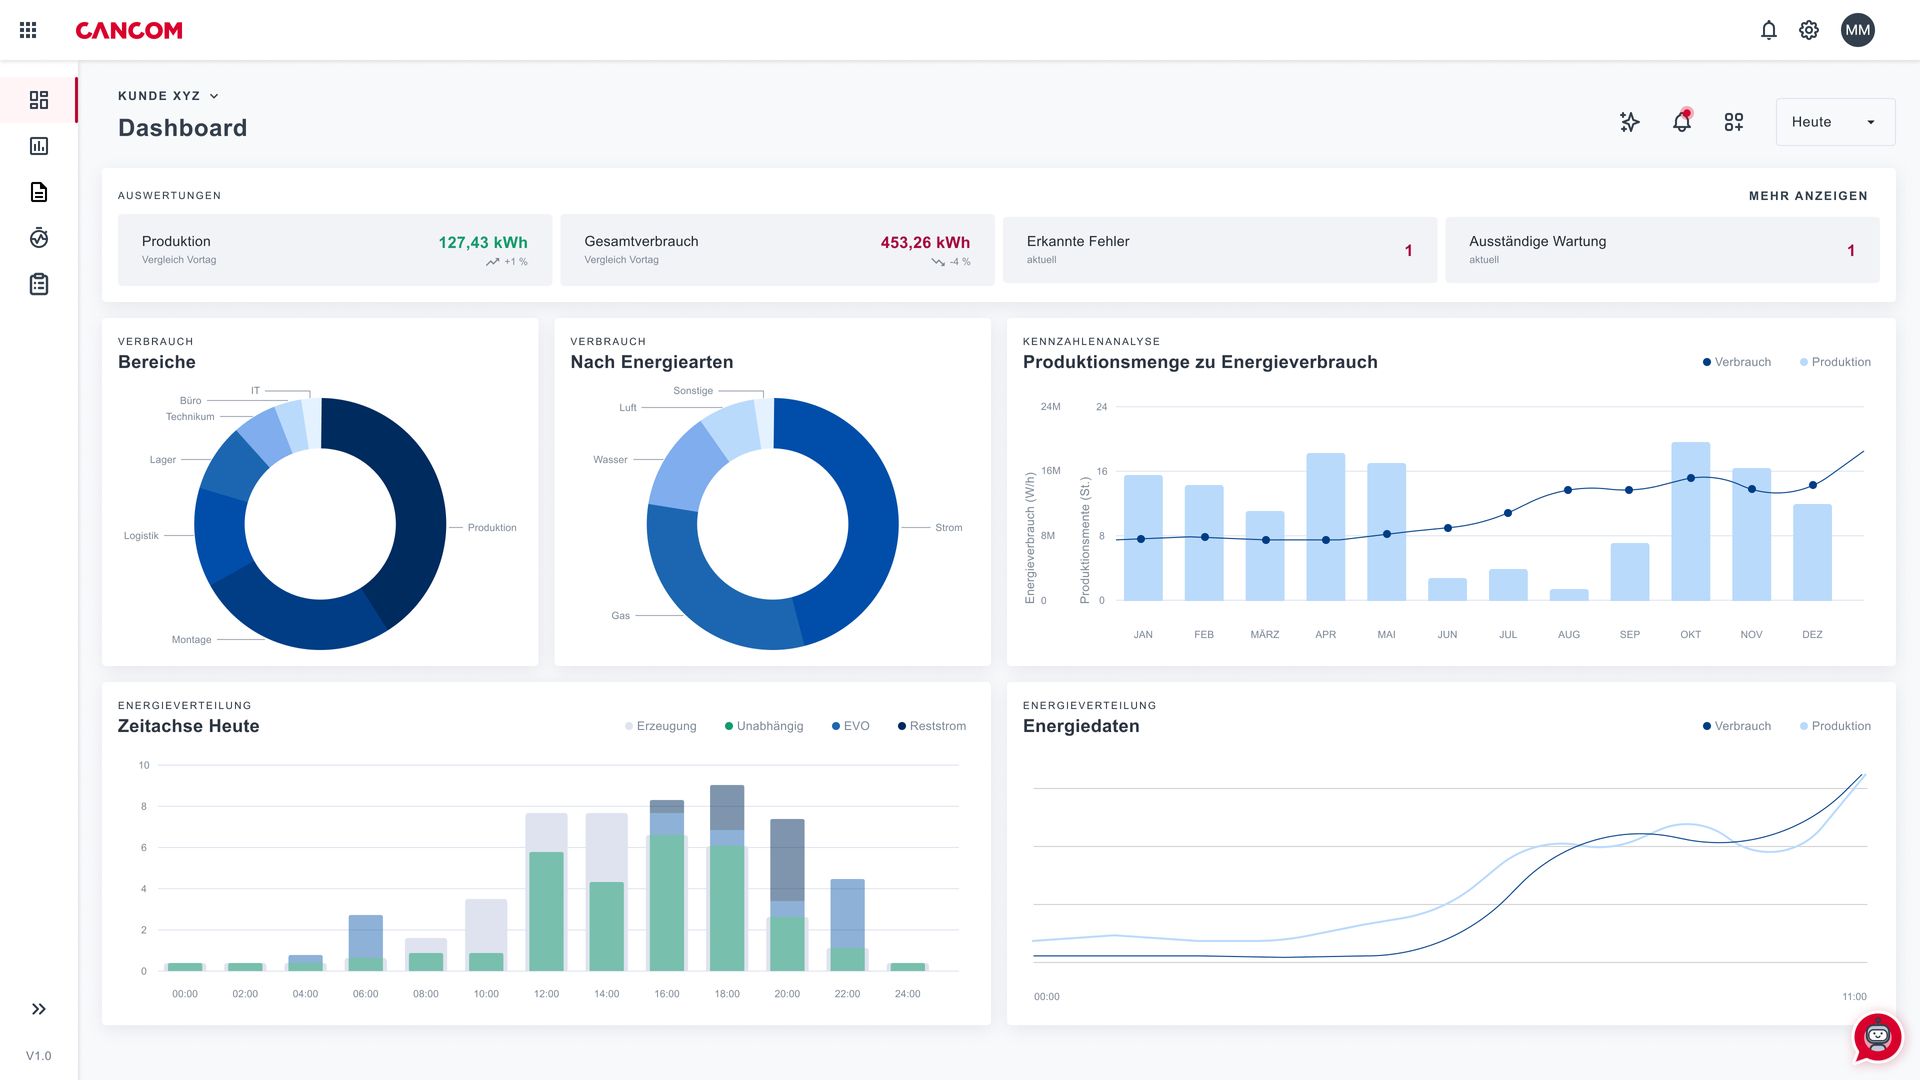
Several innovative approaches are used to create transparency. The Process data visualization with customizable dashboards makes it possible to display important information clearly and make it quickly accessible.
Through Process data analysis with predefined templates, complex data analyses can be simplified and accelerated.
The collection of Machine and operating data helps to identify and exploit optimization potential.
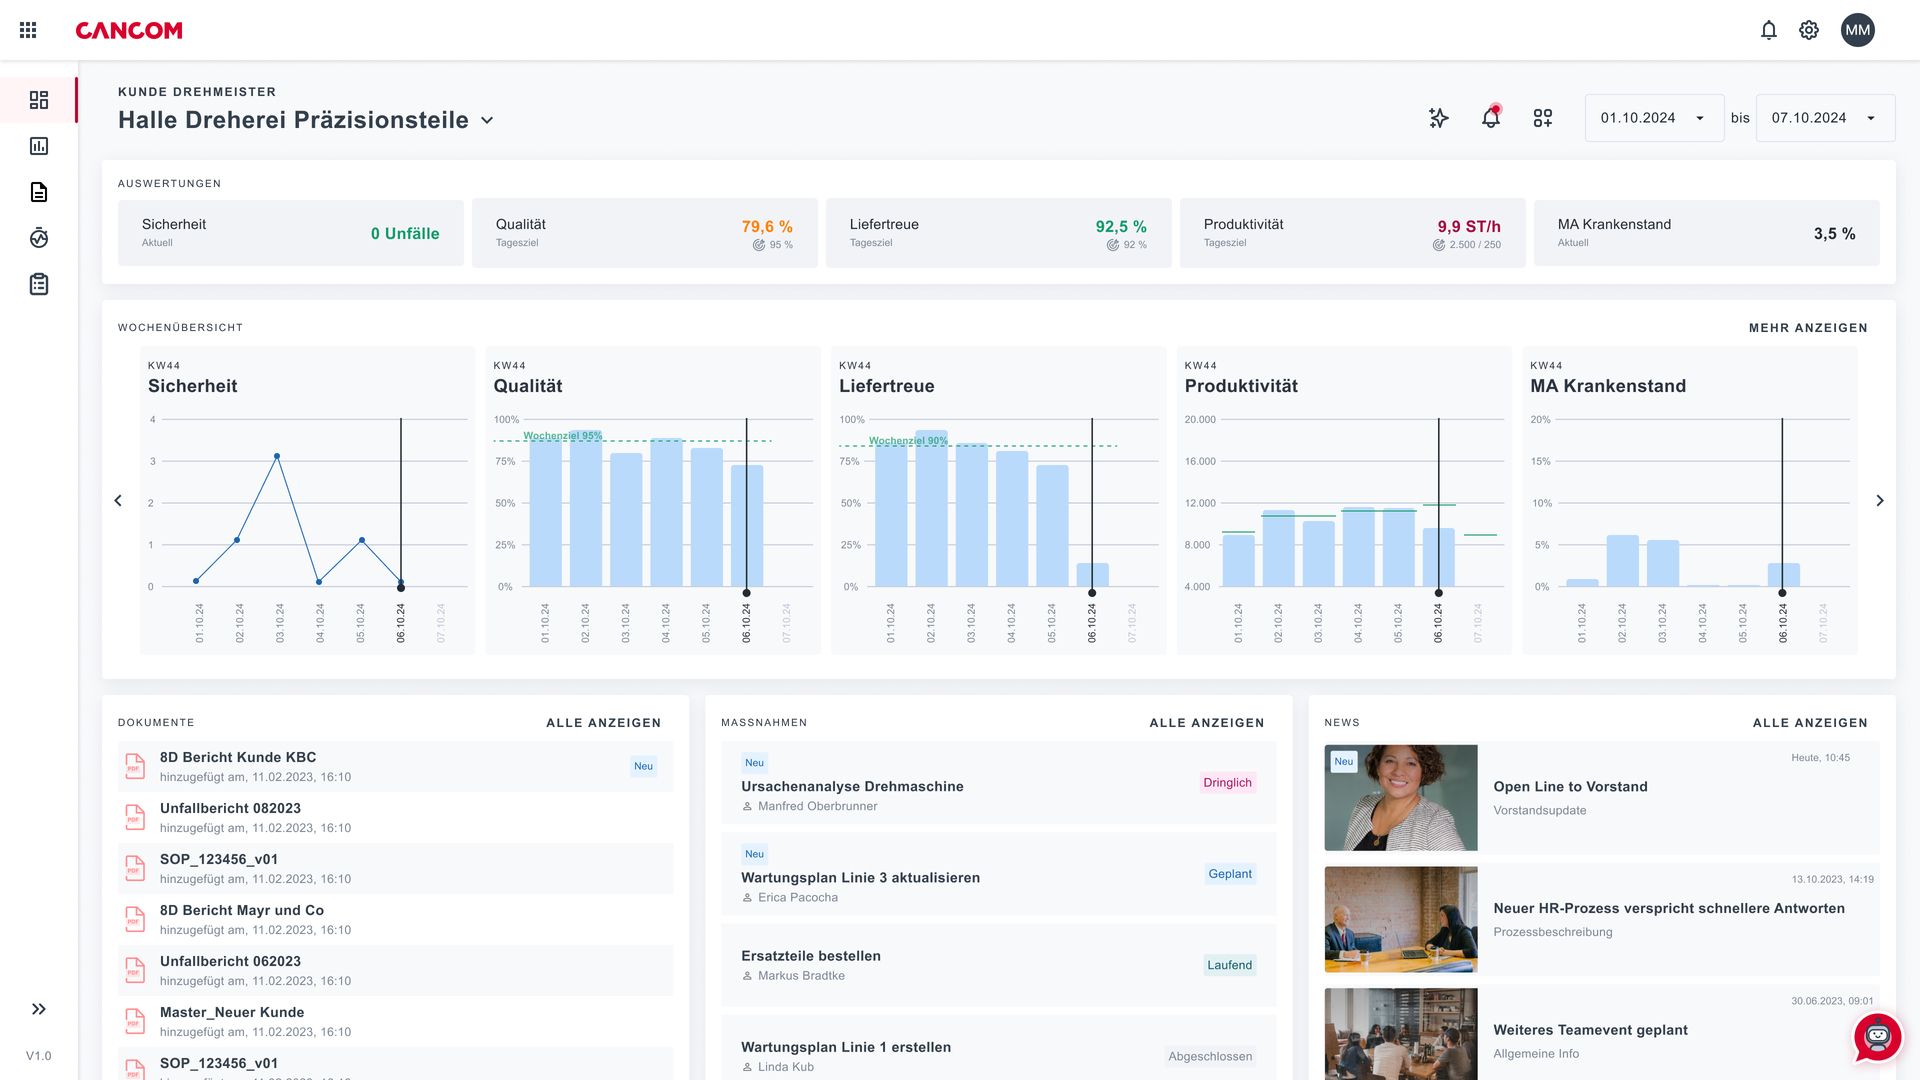
In addition, the Shopfloor Board with SQCDP (Safety, Quality, Cost, Delivery, People) supports the visualization of key figures that are crucial for joint success.

Reduce energy costs:

The integration of our Energy monitoring-Tool and the ability to communicate with energy measuring devices, gas, water and electricity meters as well as photovoltaic systems makes it possible to specify target values. In this way, the IDP helps to optimize energy consumption and significantly reduce energy costs.

How your company and your employees benefit

Industrial Data Platform - Transparency in production

How to benefit
Your employees:

SIMPLIFY PROCESSES
Centrally accessible information instead of searching through specialist departments

LIVE PRODUCTION DATA
No more handwritten lists or outdated Excel sheets

FOCUS ON CORE DATA INSTEAD OF REPORTING
As an employee in a specialist department, invest less time in data collection and preparation

REACT BETTER.
ACT FASTER.

How to benefit
Your company:

INCREASEEFFICIENCY
Use production and employee resources more efficiently. Advanced analytics and optimization based on AI solutions

COSTREDUCTION
Well-founded decisions based on comprehensible facts. Minimize time-related costs as well as downtime costs

TRANSPARENT PRODUCTION
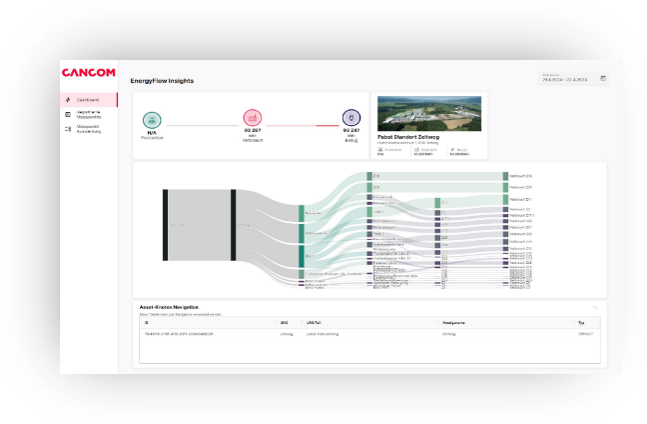
Effectiveness, real-time analyses and energy flows always visible at a glance

HIGHER TURNOVER.
LESS EFFORT.

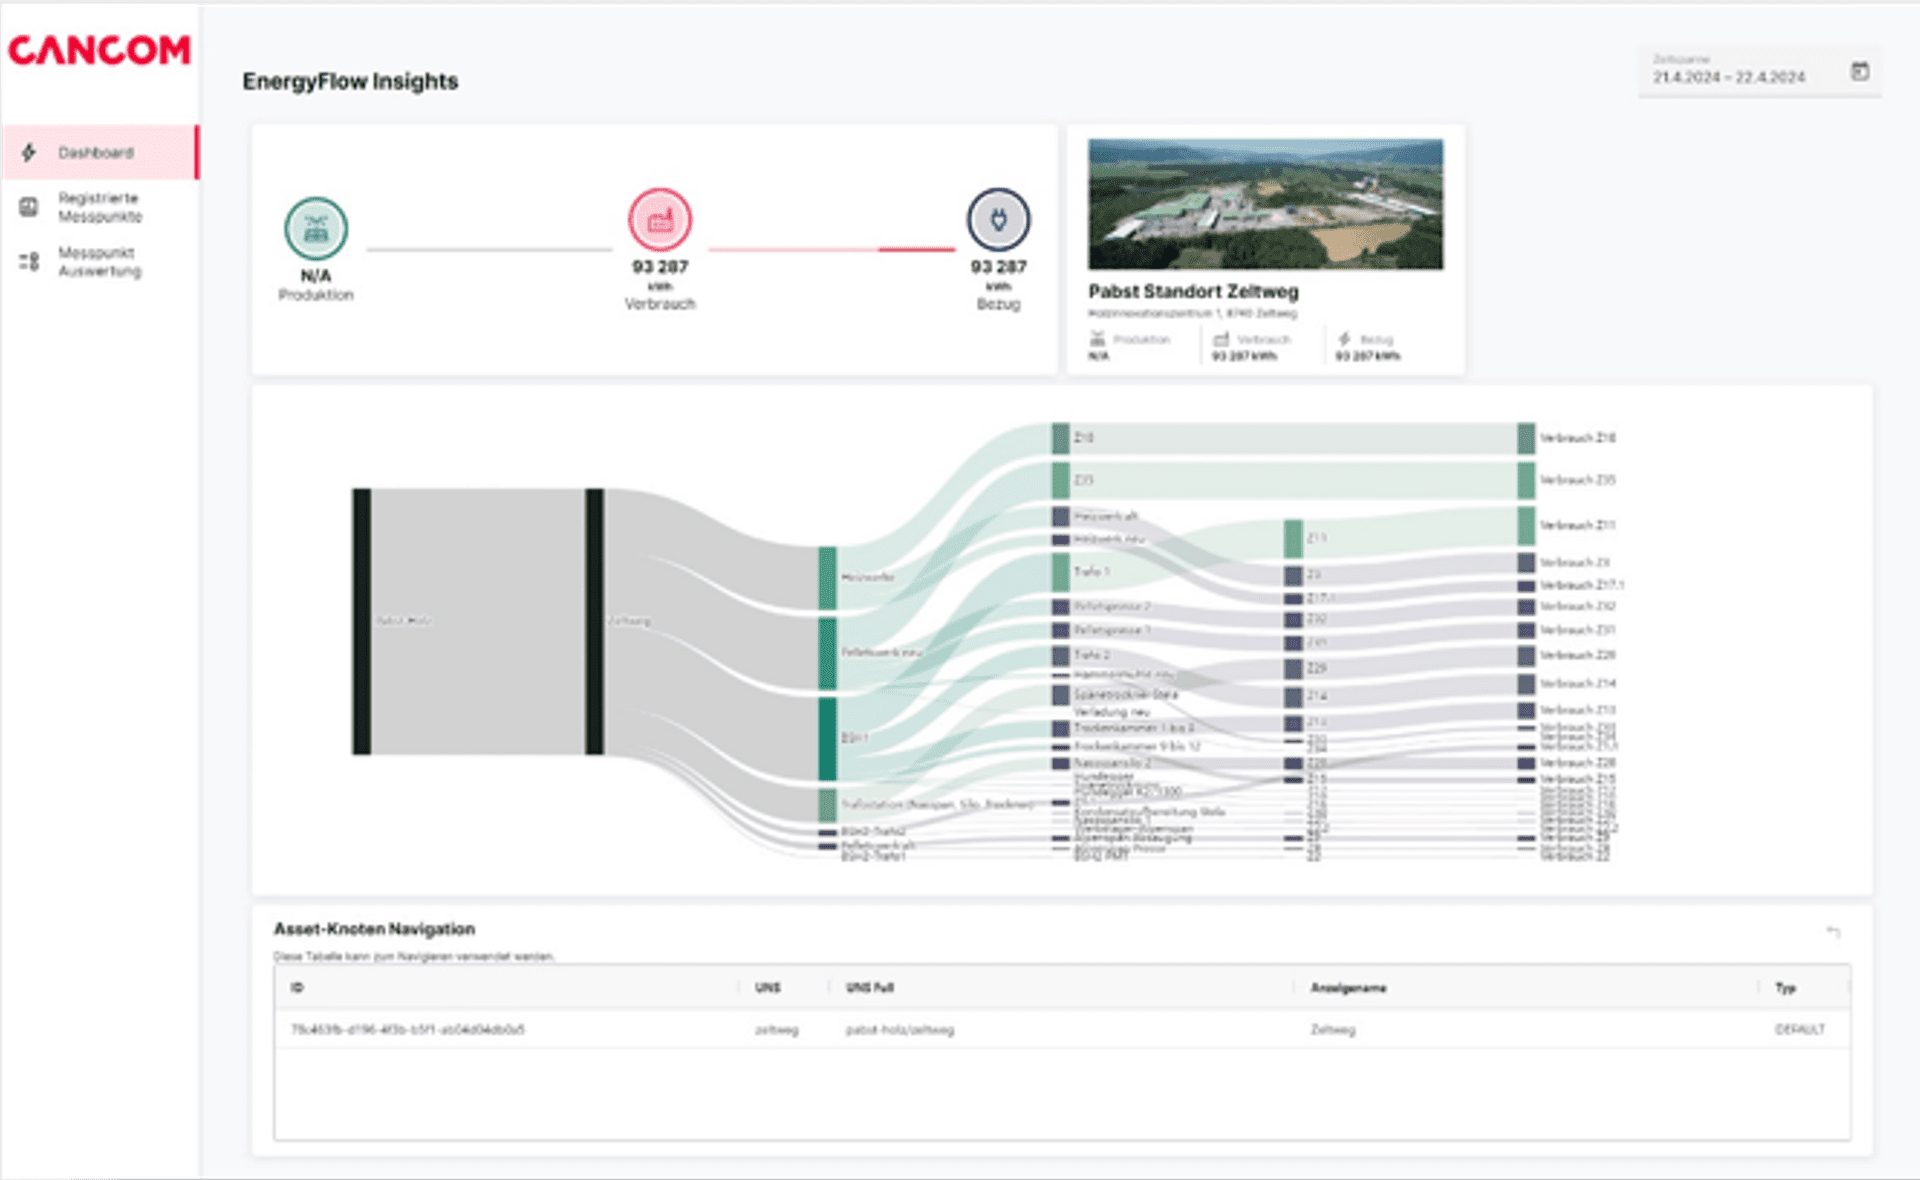
MODULE: Energy monitoring

At a glance:

  • Energy flow dashboards
  • Source-sink diagram
  • Reporting - basis for ESG reports
  • Detailed analyses
  • Meter connections via central data hub
energiemonitoring-2285x1404

Advantages:

  • Identify energy consumption
  • Reduce costs
  • Integration of measuring points from the entire company
  • Create individualized reports
  • Determine CO2 footprint
  • Historical processes
  • Traceability of energy flows

MODULE: Smart Planning

At a glance:

  • Rough planning / detailed planning / forecast
  • Integration into your company's planning ecosystem
  • AI-based optimization algorithm
  • Simulation of planning and reporting on planning bottlenecks
  • Connection to ERP, MES and other systems via central data hub
SmartPlanning Planung2

Advantages:

  • Acceleration of planning processes
  • Increased efficiency through optimized use of resources
  • Cost reduction by minimizing time-related costs and downtime costs
  • Flexibilization of production through better planning
  • Intuitive interface for efficient production planning
  • Relief for production planners
  • Individual thanks to modular system and customizations

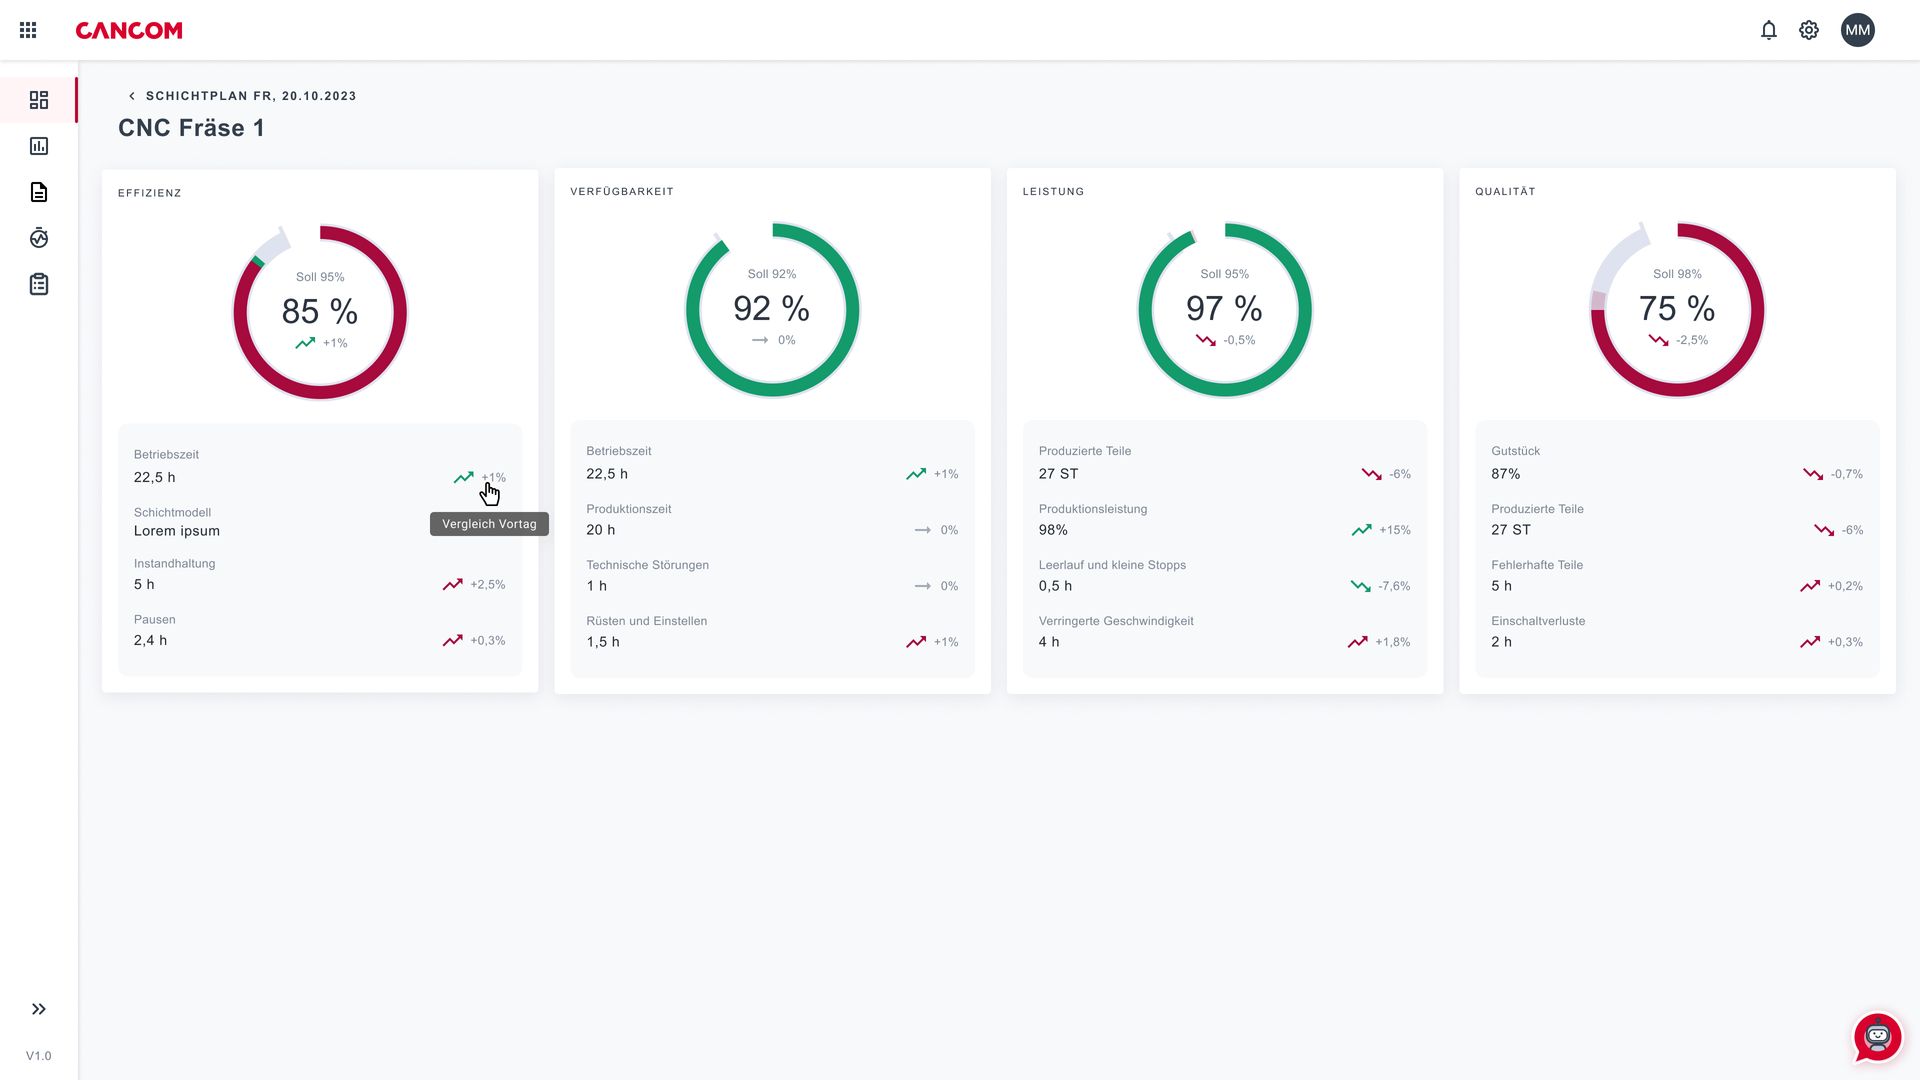
MODULE: OEE Dashboard

At a glance:

  • Real-time monitoring of production performance
  • Visual representation of the OEE key figures
  • Direct connection to machines for automated data acquisition
  • Customizable reports for detailed analysis of production losses
  • Early detection of deviations through automated warnings
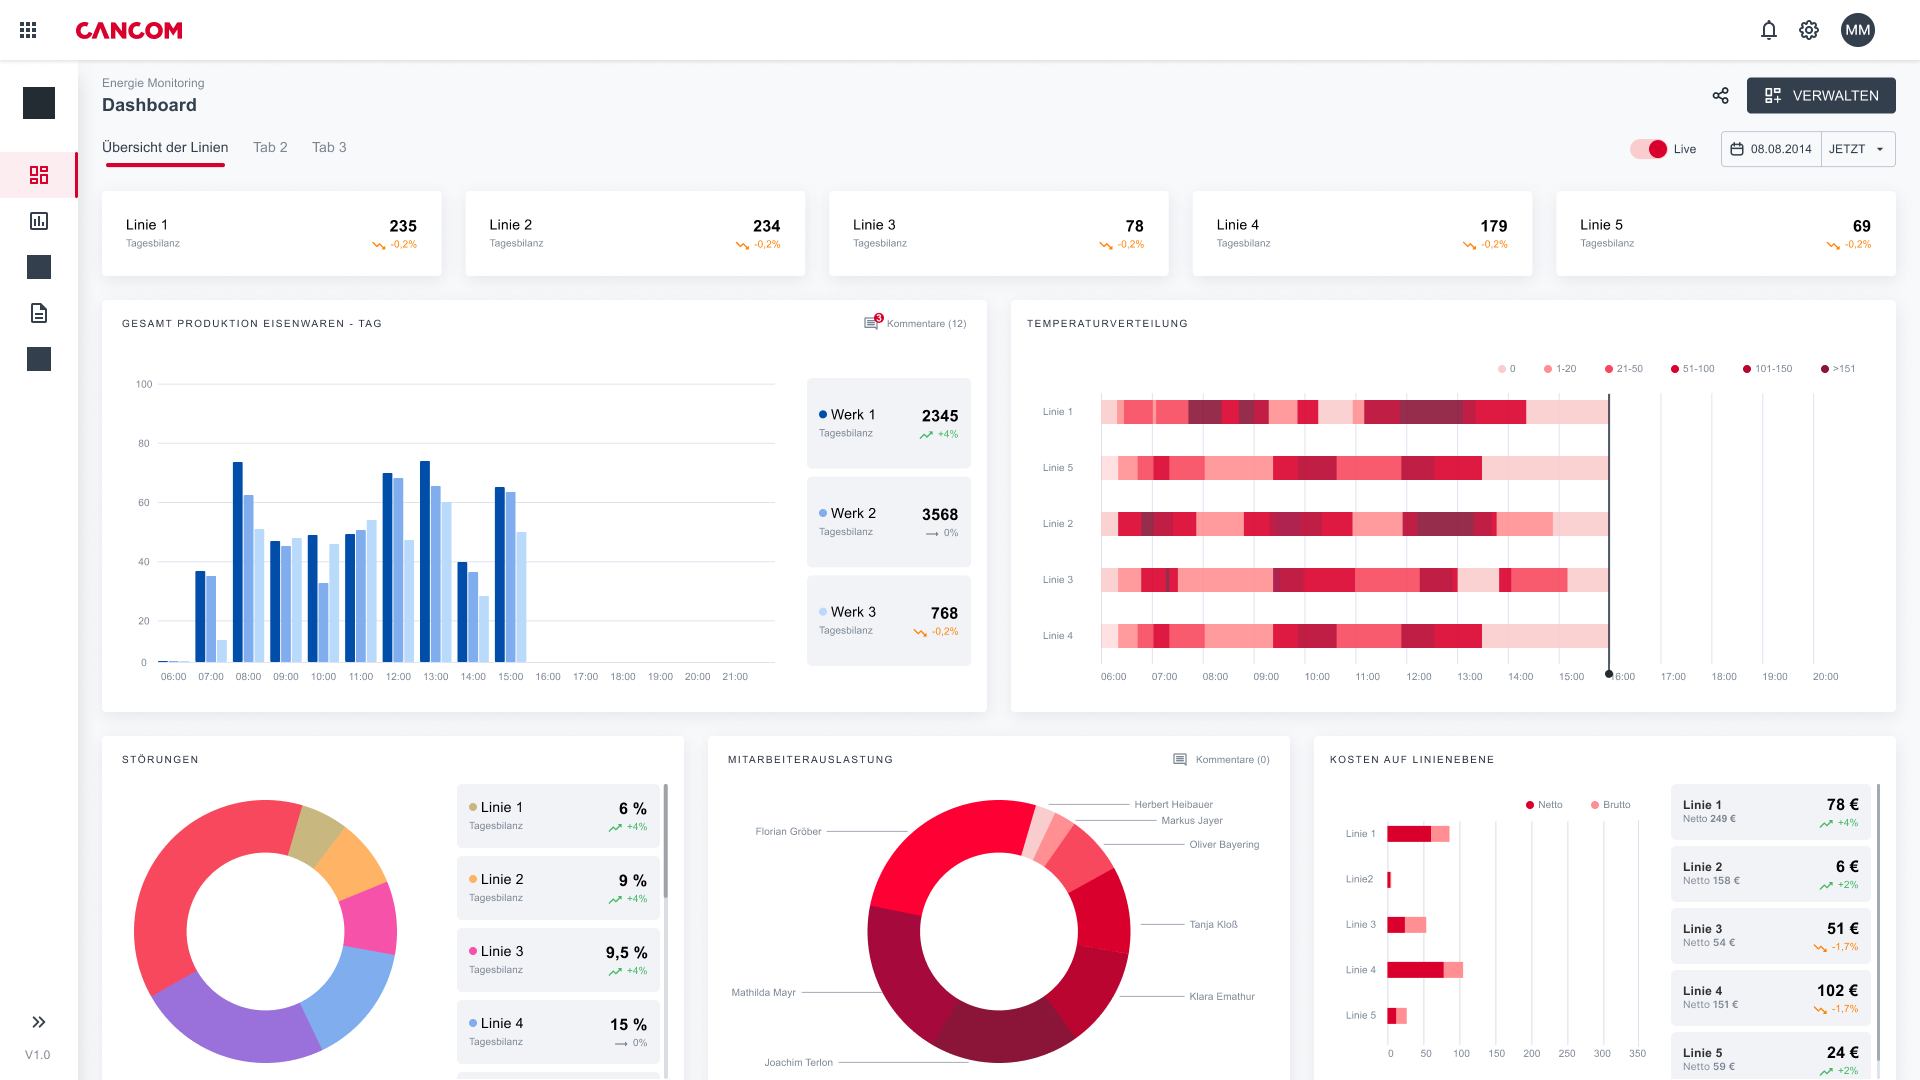
OEE Dashboard2

Advantages:

  • Real-time monitoring of production
  • Quick identification of bottlenecks
  • Reduction of unplanned downtimes
  • User-friendly, visual interface
  • Automated reporting and analysis
  • Improved decision-making through clear data
  • Optimization of resource utilization and workload

MODULE: Machines & production data acquisition

At a glance:

  • Simplified analysis of production processes
  • Real-time transmission of operating data
  • Centralized data collection of all machines
  • User-defined dashboards and reports
  • Integration of various data sources
MDE Dashboard-1529x807

Advantages:

  • Automated data acquisition in real time
  • Improved production transparency
  • Reduction of manual input errors
  • Quick identification of optimization potential
  • Flexibility in data integration
  • Support for well-founded decision-making processes
  • Simple visualization of complex data

MODULE: Process data analysis

At a glance:

  • Comprehensive analysis of process data
  • Identification of deviations and trends
  • Integration of real-time and historical data
  • User-friendly visualization of results
  • Support for continuous improvement processes
pzda-3135x1547

Advantages:

  • Early detection of process inefficiencies
  • Sustainable improvement in product quality
  • Detailed trend analyses and reports
  • Support for data-based decision-making
  • Reduction of rejects and rework
  • Customized analysis tools for users
  • Long-term increase in production output

MODULE: Process data - Visualization

At a glance:

  • Intuitive graphical representation of data
  • Real-time visualizations for better insights
  • Integration of different data sources
  • Interactive analysis tools for deeper insights
  • Customizable dashboards for different users
Prozessdatenvisualisierung

Advantages:

  • Clearly understandable data presentation
  • Reduce costs
  • Efficient use of data for decision-making
  • Support with troubleshooting
  • Flexibility in dashboard customization
  • Improve communication within the team
  • Promote collaboration through visualization

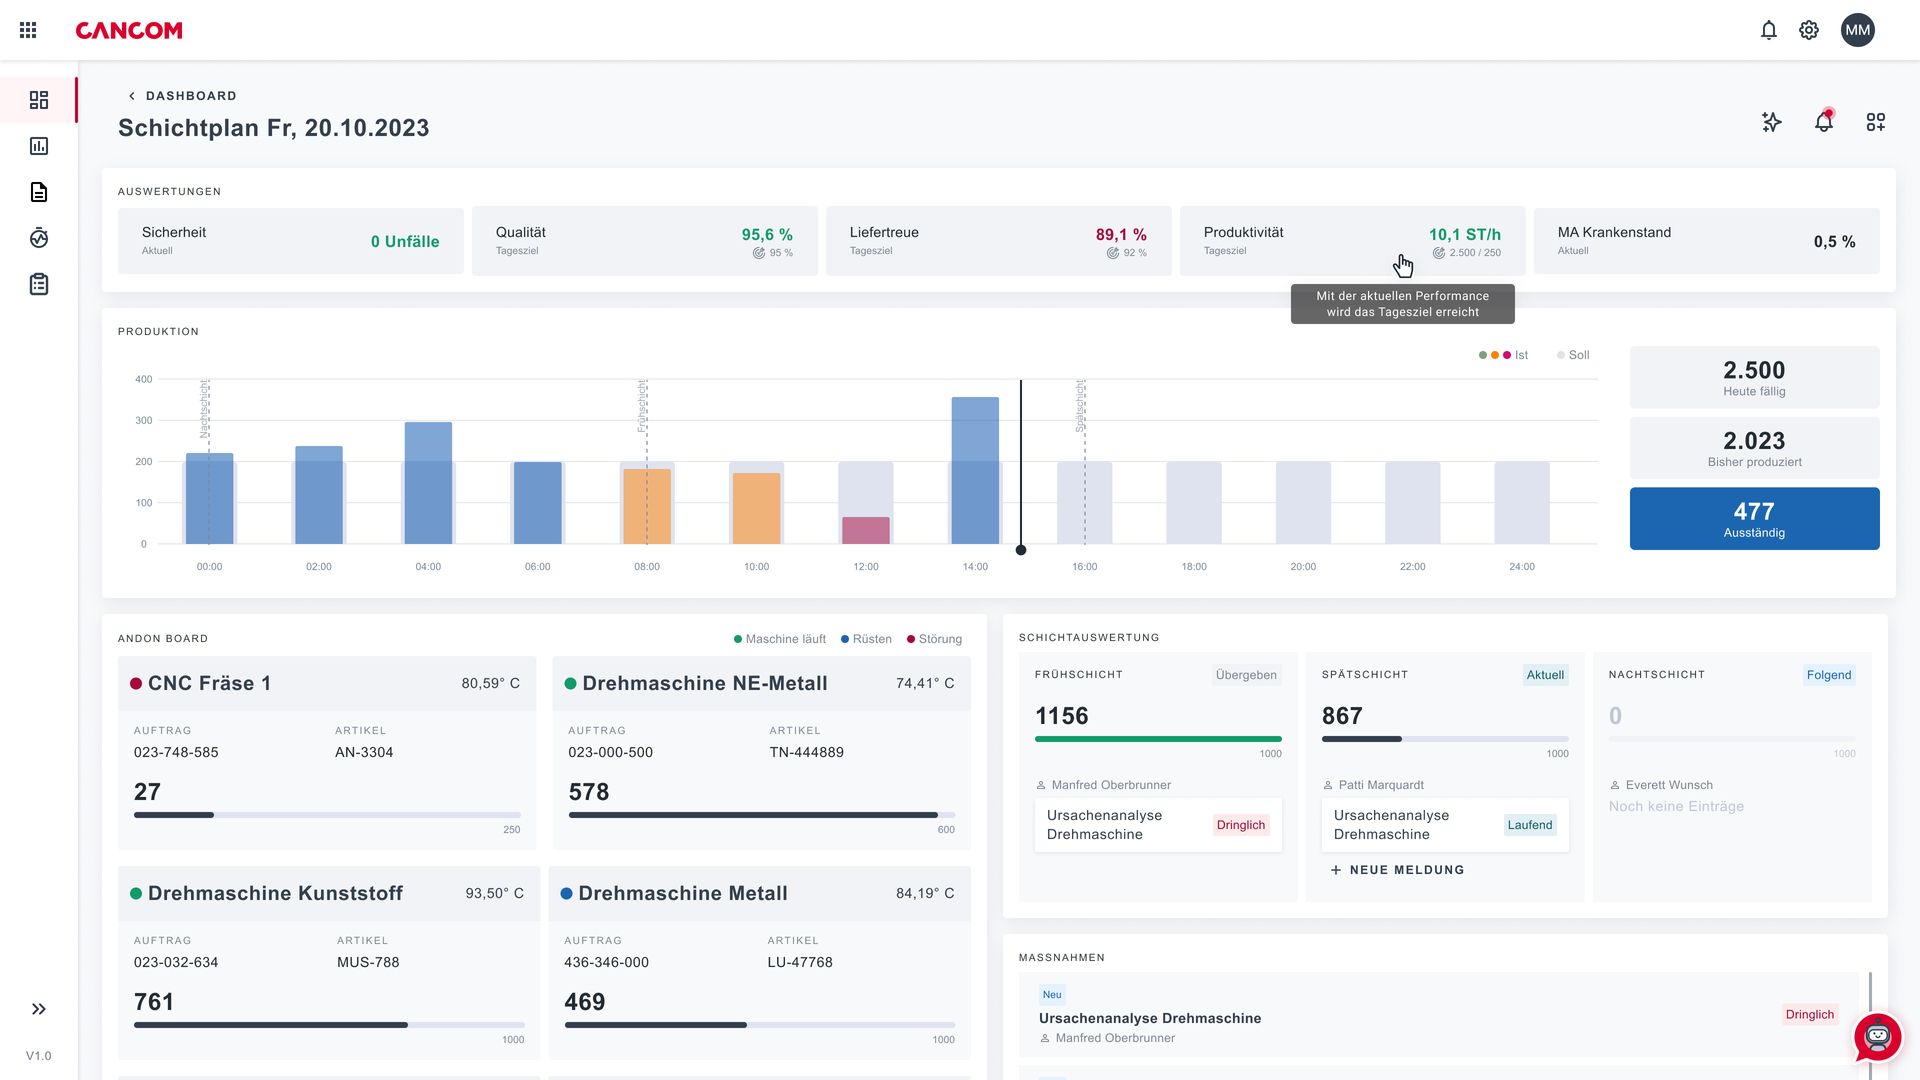
MODULE: Shopfloor Board

At a glance:

  • Visualization of key performance indicators on the store floor
  • Real-time updates on process performance
  • Promotion of team communication and commitment
  • Simple tracking of target achievement
  • Support for the SQCDP principles
ShopfloorBoard

Advantages:

  • Support in solving problems on site
  • Promotion of a continuous improvement culture
  • Increased accountability within the team
  • Integration of feedback mechanisms
  • Clear presentation of performance targets
  • Strengthening team spirit and motivation
  • Immediate reaction to deviations

More CANCOM Digital Makers products at a glance:

Cloud Data Platform

Read more

Customer Platform

Read more

Company GPT with SOI

Read more

Energy management

Read more

Smart Planning

Read more

Smart Products

Read more

Contact
CANCOM Austria

Request now

How may I help you?